
News From The Port
October 2020
The Port of Walla Walla has been focused on various infrastructure development projects and business support efforts over the past several months. Due to the impacts of COVID, the operations of the Port have changed, but the volume of work and productivity of staff has continued to flourish. The Port Commissioners and staff continue to focus on projects and activities that support the mission of the Port of Walla Walla. The mission statement is “working to enhance the economic vitality of Walla Walla County.” The measurement of success of the mission is our ability to:
- Create and retain family-wage jobs
- Expand the region's tax base
- Maintain multi-modal transportation linkages
- Provide leadership in enhancing Walla Walla County's overall economic vitality and quality of life
The Port manages many different real estate assets that allow for the mission to be accomplished. Through the development of various public infrastructure investments, the ability to support businesses, large and small, provides the business environment for successful employment opportunities. Strategic investment in public water systems at the Airport, Burbank, and the new Wallula Dodd Water System (WDWS) allow for the continued support and capacity to provide adequate water for a number of business that provides great employment opportunities and is a fundamental utility to allow for new business development options within Walla Walla County.
In addition to water system developments, the Port is working on various significant Airport related improvements, as a result of the receipt of federal Cares Act funding. A number of building and utility system improvements will begin to be completed over the next four years. The improvements will address various maintenance-related improvements and will provide for some visual and noticeable changes at the Airport Business District.
Another exciting project update is the start of construction on U.S. Highway 12 – Phase 7. This project will continue the four-laning from Frenchtown to Nine-Mile hill. This 11-mile stretch will see construction activity in 2021-2023. The continues the efforts of the US 12 Coalitions decade-plus efforts to improve access, safety, and freight mobility along this corridor.
As we continue to provide services and address the various demands and needs of the business community during these unchartered times, the Port of Walla Walla stands ready and able to lead us into a successful future in Walla Walla County.
Patrick H. Reay, Executive Director

Feeding America and 2nd Harvest Food Banks
Food Insecurity and the Impact of COVID-19
by Trends Staff
2020 has presented us with more than a few unique challenges. The most strenuous are likely those existing before the COVID-19, ultimately made worse by the pandemic. The most concerning are any increased challenges to the most basic necessities of life: food, clothing, and shelter.
Every year, Feeding America calculates the estimated shares of both the overall and youth populations who had faced with food insecurity “to improve our understanding of food insecurity and food costs at the local level.”
Feeding America defines hunger as “a personal, physical sensation of discomfort” and food insecurity as “a lack of available financial resources for food”.
Feeding America uses the U.S. Department of Agriculture two-part definition of food insecurity:
- Low food security “reduced quality, variety, or desirability of diet. Little or no indication of reduced food intake.”
- Very low food security “multiple indications of disrupted eating patterns and reduced food intake.”
While it is too early to know what the current shares of Walla Walla County food insecurity, Feeding America recently released the 2014-2018 food insecurity estimates along with new 2020 estimates taking into consideration the impact of COVID-19 on food insecurity.
This information is available in a data visualization called Map the Meal Gap. Specifically, this visualization shows a map of the U.S. and the shares of the total and youth populations having struggled with food insecurity in the last 12-months.
Without giving everything away, during the 2014-2018 time period (using a 5-year moving average) the share of the total population who faced food insecurity in:
- Washington State was 10.7%. The share of the youth population was 14.7%.
- The U.S. was 11.5%. The share of the youth population was 15.2%.
It’s too important of a subject not to have a look at Walla Walla County, neighboring counties, and other states as benchmarks to Washington State, so we are not providing them here – you have to look at the data visualization. While each location in the U.S. likely has unique challenges regarding food insecurity, the methodology allows for a direct comparison of estimates for any location offered in the map.
According to their website, “Second Harvest distributes over 2 million pounds of free food each month to help people in need in 26 counties in Eastern Washington and North Idaho.” Click to learn more or about how you can help.
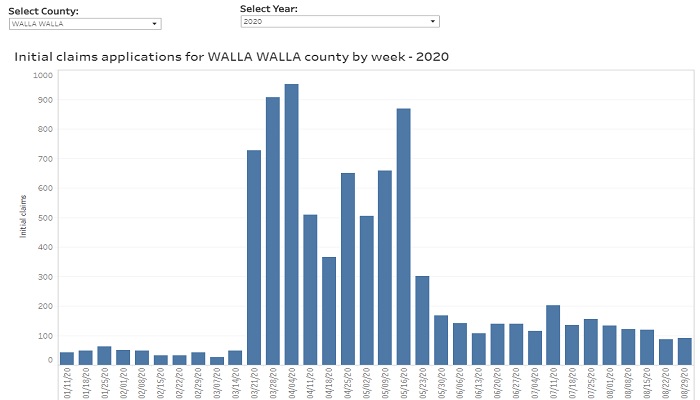
Unemployment Insurance Initial Claims Weekly Dashboard
Initial claim totals, by supersector (state) and 3-digit NAICS industry sector (by county)
by Trends Staff
In the United States during 2020, numbers for both job creation and job losses have been in the millions and tens-of-millions. While both are part of the economic impact of COVID-19, the national unemployment rate reached 14.7% during April, 2020.
According to the U.S. Bureau of Labor Statistics, 14.7% is the highest rate since January, 1948, using these methods.
Since April, job growth has also been unprecedented, such as the 4.8 million added nationally during July, 2020 and the 1.4 million during August, 2020.
National figures are important, but most workers are limited to employment within proximity to where they live.
The Washington State Employment Security Department, Labor Market and Economic Analysis has created a new data interactive with helpful information for each county and for the state overall.
There are four main tabs: weekly initial claims (state), initial claims by industry supersector (state), initial claims by county, and county initial claims by industry sector (3-digit NAICS).
The interactive begins on the first tab showing a weekly view of the overall total initial unemployment insurance claims in Washington State. The second tab drills into these data showing initial unemployment insurance claims within 21 industry sectors, such as healthcare & social assistance, manufacturing, retail trade, construction, and mining.
The third and fourth tabs offer similar views, but for counties in Washington State.
The overall total initial unemployment insurance claims by county mirrors the tab for the state showing overall total initial claims. The fourth tab shows initial claims for unemployment insurance, on a weekly basis, in over 90 industry subsector categories, for every county in the state, for both 2019 and 2020 YTD.
Keep checking back as this interactive updates each week.
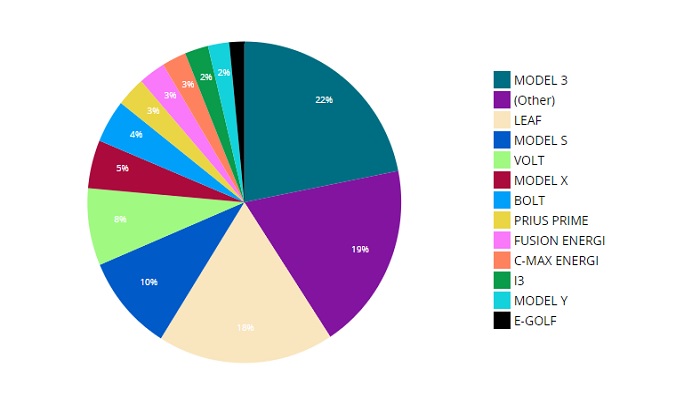
Electric Vehicles in Washington State: Access Washington – data.wa.gov
Currently registered vehicles by vehicle type and by county
by Trends Staff
When something is the first, there is no need to put a number after it – until there is more than one. Examples include the modern Olympic Games, movies with a sequel, and the Sony PlayStation.
The same can be said for an Industrial Revolution. While the term has somewhat come to represent the sum of human technology and advancement, there have been three separate Industrial Revolutions throughout history. Some argue we are currently in “Industry 4.0”, or the Fourth Industrial Revolution where cyber / internet is advancing allowing our physical, digital, and biological worlds to swirl and blend together.
While we do know cyber / internet has changed society, we will leave this for future historians to consider.
If we are living in Industry 4.0, this era will continue to produce inventions changing our lives and future generations. Inventions driving humanity forward, for better or worse, such as the internal combustion engine, electric engine, jet engine, and the internet search engine.
A few years ago, owners of electric cars could drive very limited distances from home – or at least within proximity to electrical outlets. As the number of electric vehicles increases, demand for a new infrastructure, charging stations, also increases. For hybrid vehicles (those using both gas and electricity) this is much less of a concern.
Today, Washington State has developed a significant electric vehicle charging infrastructure, including being part of the West Coast Electric Highway. This has literally opened the road for electric vehicles, generating new public and private investment to continue building the electric vehicle charging infrastructure across Washington State.
Eventually “gas-burners” will go the way of the dinosaur, but not overnight. Knowing the number of electric vehicles on the road is helpful, but a specific location helps investors know where increasing the charging infrastructure is needed most.
Further, knowing the exact type of electric vehicle popular in a specific location might shed light on a community’s commitment to electric vehicles by purchasing more of them overall, or a larger percentage of high-end models than elsewhere in the state.
Data.wa.gov has created a new data visualization showing all currently registered Battery Electric Vehicles (BEVs) and Plug-in Hybrid Electric Vehicles (PHEVs) in the state. Filters include vehicle type (BEV and PHEV) and model, but also by county, city, and legislative district.
This information likely will not be part of a future Fourth Industrial Revolution conversation, but it can help both public and private entities make informed decisions now.
Among Walla Walla’s Largest Sectors, Agriculture & Healthcare Have Shown the Greatest Wage Gains
by Dr. Patrick Jones
Ideally, we’d like all our jobs to pay better than average. But then we’d be entering into Lake Woebegone territory, where all the children are above average. Mathematically, that statement just doesn’t work.
Walla Walla Trends Indicator 1.1.5 tracks the path of annual average wages paid to workers in the five largest sectors in the economy, as measured by headcount. It’s a busy graph that can be simplified by clicking on the legend boxes below to reduce the number of lines. Let’s just look at those in red, that is, those for Walla Walla.
It’s easy to see that a large spread characterizes the wages paid in the five largest sectors. For 2019, the highest-paid sector here was government, with an average annual wage at slightly over $59,000. This includes federal, state and local agencies as well as local school districts. The lowest paid of the five largest was retail trade, at about $28,350. Clustered with government was manufacturing, which has been the highest paid of the large sectors at times. Bunched at the low end with retail was agriculture. The latter have consistently been the lowest earning of the group. In the “upper middle” is (and has been) healthcare, with an annual wage of slightly over $50,000.
Three of the sectors depicted here show average annual wages greater than the overall average (see Indicator 1.1.4 and the companion article in this issue). In 2019, this average stood at $46,219. Is Walla Walla bending the laws of arithmetic with 3 of its largest five sectors showing above average numbers?
Not quite. There are 14 other sectors in this arrangement of industries. Some enjoy considerably higher annual wages or salaries, such as professional services, at over $60,000 in 2019. But it’s a small sector. A much larger sector, hospitality (food and lodging services) yielded an average wage in 2019 of slightly over $21,000.
Why care about the status of wages and salaries by sector? They largely determine the path of the Walla Walla economy, not to mention the desire of most everyone to earn a bit (or a lot) more. Wages and salaries form the thickest leg of the three-legged stool that comprises personal income. (The other two legs consist of investment income and federal transfer payments.) Unless one imagines an economy like Jackson Hole, WY, where more than half of reported personal income flows from investments, wages and salaries drive economic progress. (The current share of Walla Walla total personal income taken by investment income is about 24%.)
I assume that Walla Wallans would like to experience growth in wages and salaries, and therefore incomes. To affect the influence the annual wage, two choices are available: increases wages in the largest sectors or boost the numbers employed in the highest-paying sectors. Which of the two paths is more promising isn’t certain. Is it likely that government, especially federal and state agencies, will add to their staff over the next few years? Is it likely that manufacturing will boost head counts? If so, that would fly in the face of secular trends: manufacturing output continues to increase but not its labor force. Is it likely that professional & technical services (engineers, architects, lawyers, accountant, computer consultants) will make meaningful additions to their staffs here in the future?
How promising is the other path to increased incomes, increasing wages among the existing workforce? This writer’s view is promising for certain sectors. In particular, those that are amenable to productivity increases. One view held by nearly all economists lies in the key role played by labor productivity gains; wages should grow in a non-inflationary way if they match (and don’t exceed) the productivity gains in that sector.
Productivity gains certainly seem likely for manufacturing, where technology adoption has consistently spurred higher output per person over time in the U.S. and likely here. A sector with wages that have risen rapidly that might surprise readers is agriculture. Among the top five employing sectors, its earnings increases have outpaced the other four, with a compounded annual growth rate of 4.9% since 2010. Contrast this result to the annual growth rate of wages in the entire County’s workforce over the same period, at 2.8%. And it’s a slightly higher rate than the 4.4% growth rate in the agricultural sector of Benton and Franklin Counties. Productivity gains have undoubtedly played a role in the fields, orchards and vineyards of the Valley.
How have earnings in Walla Walla’s top five sectors relative to the Washington State top five employing sectors? Click the WA legend boxes back on, one by one, to see. First note that the state mix is a bit different: hospitality replaces agriculture. Second, annual growth rate calculations reveal that workers statewide in government and manufacturing have experienced slightly faster expansion of their earnings than in Walla Walla over the past decade. In contrast, Walla Walla healthcare workers have seen their earnings grow a slight bit faster than across the state. The big contrast comes in retail. Statewide, retail wages have climbed over 8% vs. the nearly 2% here. Chalk that gap to the Amazon effect.
Of course, wages can rise simply because of supply and demand factors. While there may be some niche occupations where demand remains unfilled (think nursing), it appears to this writer that most increases in local demand for workers can be met for the foreseeable future, especially given the presence of a large labor market in the Tri Cities. An exception might be agriculture. Given the challenges of finding agricultural labor, supply and demand forces are likely at work in that sector as well as productivity gains.
Further, wages can rise due to collective bargaining and policy changes. Yet, outside of the public sector and perhaps hospitals, the pulse of unions in the local economy seems faint. The most significant policy change in the local labor market, the rapid rise in the minimum wage, is largely behind us.
So how will incomes rise in Walla Walla in the near term? For sure, the growing presence of retirees here should add some lift to the categories of investment returns and federal transfer payments. But wage earnings will still be the thickest leg of the stool. Let’s hope that (the yet unmeasured) productivity gains keep coming. And perhaps some sectors that are relatively small but produce earnings higher than average, such as wholesale trade, professional & technical services, and finance, will take up a bigger slice of the Walla Walla labor workforce.
Top-4 Leading Causes of Death Show A Decreasing Combined Overall Share: Individually, only 1 of the top 4 causes has increased
by Scott Richter and Dr. Patrick Jones
Leading causes of death vary for different age groups. It is a safe assumption that younger people have a higher share of deaths from accidents (unintentional injuries) and intentional self-harm (suicide) than older people. Older folks experience a higher share of deaths from heart disease, stroke, and a variety of physical health issues than their younger counterparts.
Typically, the top causes of death will represent older age groups than younger age groups. Ultimately, when the top causes of death are known, they identify areas within a community where possible prevention or health maintenance activities can be directed.
Looking at Indicator 4.1.2 on Walla Walla Trends, the Top-4 Causes of Death indicator, we see they are Cancers, Heart Disease, Alzheimer’s Disease, and Stroke.
This indicator uses the "List of 113 Selected Causes of Death," which was developed by the National Center for Health Statistics and is based on their level of public health and medical importance. The list includes common major conditions such as (but not limited to): heart disease, respiratory diseases, hypertension, and chronic liver disease. It also includes less common but still major causes of death such as (but not limited to): legal interventions, hernia, and peptic ulcer. The full list can be found here (see page 22).
When state benchmarks are used in Indicators like the Top-4 Causes of Death, they are not necessarily the top causes in the state. Instead, the state benchmarks reflect the overall state shares within the same categories as the top causes of death within the county to allow direct comparison of the county and state.
Deaths occurring at the Washington State Penitentiary, located within the county border, are also included.
Not shown in the graph are Accidents - a top-4 cause of death in both Walla Walla County and Washington State. This Indicator only shows deaths resulting from health-related diseases, excluding other causes of death such as by accident and by intentional self-harm (suicides).
For example, during 2018 in Washington State, chronic lower respiratory diseases held a higher ranking than cerebrovascular diseases, a top-4 cause of death in the county.
While individual counties are not offered within the state benchmarks, the Compare feature provides a similar look for counties across the state with a Trends project. Counties include Benton, Chelan, Douglas, Franklin, Grant, Skagit, Spokane, and Yakima.
Looking again at Walla Walla County only, we see that from 2000 to 2018 Alzheimer’s Disease was the only cause of death with an increasing share (5.8% to 11.4%). This increasing share might partially be explained by the share of the population ages 65+ in Walla Walla County increasing by more than five-percentage-points from 2000 to 2018 (14.8% to 20.2%).
Also, from 2000 to 2018, the share of deaths in Walla Walla County caused by:
- Stroke decreased from 9.6% to 5.9%, while the state decreased from 8.4% to 5.1%.
- Heart Disease decreased from 25.0% to 20.4%, while the state decreased from 25.8% to 20.5%.
- Cancers decreased from 23.5% to 20.9%, while the state decreased from 24.3% to 22.5%.
It should also be noted the combined shares of the top-4 causes of death have decreased in both the county and state since 2000. More specifically, the Walla Walla County total has decreased from 64.0% in 2000 to 58.6% in 2018 (-5.4 percentage points), and the state has decreased from 62.7% to 54.6% (-8.1 points).
While decreases are good, as individual shares for different causes of death, they account for all deaths. If one or more causes of death show significant increases but are not one of the top-4 causes, they are still potentially affecting the shares of the top-4 causes. In Walla Walla County, a few examples include: diabetes, chronic liver disease, gallbladder disease, and peptic ulcer. Specifically, these are not a top-4 cause of death but have registered a higher number of people dying from them in 2018 than 2000.
Net High Paying Jobs Created Plagued by Unpredictability
by Brian Kennedy and Dr. Patrick Jones
While adding jobs important to a community, adding well-paying jobs has increasingly become the priority of economic development organizations and policy makers. Higher wages allow for more discretionary money to be spent locally where the impacts can be felt throughout the county. Following the trend presented here allows Walla Walla residents to track the growth high wage jobs in the labor market. The short story: a recovery in 2019 from a prior years’ decline and actual growth compared a sharp drop statewide, a return to parity doesn’t seem too bad.
Indicator 1.3.7 tracks the total number of jobs and annual growth rate of jobs added that had wages 25% higher than prior year’s annual average wage. That sounds like a mouthful, but it is pretty simple to break down. To be counted in this indicator for 2019, an occupation must have an average annual wage that was 25% greater than 2018’s average wage. In 2018 the average annual wage in Walla Walla was $44,615. Thus, to be counted, jobs with average annual wages for any occupation needed to surpass $55,769. An important nuance is that this trend tracks net jobs, in other words jobs lost as well as gained. Therefore, not only does the occupation need to have a high wage, we are only counting those that are more or less than the number of jobs prior year.
A look at the graph shows that between 2018 and 2019, Walla Walla only produced an additional 25 jobs that paid 25% higher than 2018’s average annual wage. This equated to a negligible gain in the average annual growth rate, posting just a 0.5% increase. While this may sound like a less than ideal result, it’s not so bad when you compare that to the state which contracted by about 10%. And it represents a local recovery from a fall of 20% in the prior pair of years.
Additionally, occupations that added jobs, albeit small, came from all sectors in the economy rather than being isolated in any one field. The Walla Walla community saw growth in graphics designers, electrical and mechanical engineering technicians, environmental scientists and engineers, and business operations, human resources and marketing research analysts. Most of these supported wages in the $60,000-$80,000 range.
Interestingly enough, the statewide trend has recently run counter to what has happening locally. When there has been growth in the state in these jobs, Walla Walla experiences a drop. In the last three years, the state has only added higher paying jobs between 2017 and 2018. In 2019, the state actually experienced a drop of 10.1% of jobs that paid 25% over of 2018’s average annual wage.
Part of this disparity between the state and local communities in Eastern Washington is a result of the disparity between wages. For jobs to be counted in the state estimate, annual wages needed to surpass $82,000. Compared to Walla Walla there is a difference of over $25,000. Based on the same measure, the difference alone is nearly half of what Walla Walla’s wage of at least $55,000 needed for added jobs that would be counted in the trend.
This trend is only being tracked in two other indicator projects in Eastern Washington: Benton Franklin Trends and Chelan Douglas Trends. Due to Walla Walla recent status as a metropolitan statistical area, there are only 3 years’ worth of data that can be directly compared to these counties.
The Tri-Cities area has shown growth every year in the last three years. Moving from 2018 to 2019 did show the low point in that trend, which happens to match Walla Walla with a growth rate of just 0.5%.
In the last three years, the Wenatchee metro area has been trending downward after a few years of decent growth. Three years ago, there was growth of about 8%, which fell to parity the following year, and then most recently has fallen to -1.5%.
As tracking the trend of higher earning net jobs becomes difficult with the limited number of observations a look at the overall net jobs, found on Indicator 1.3.3 may help shed some light on the local job market.
Overall net job growth here has been bouncing back and forth for the greater part of the last decade. One year its up, the next year its down. The last ten years has only shown growth of 1,226 additional jobs, or a compound annual growth rate of just 0.5% in the county. Mostly recently, 2019 only added 12 more jobs than were added in 2018.
While it may seem counter intuitive that overall jobs added were less than the higher earning net jobs added, it is more an anomaly of the difference in datasets, and the specific numbers aren’t the important bits but rather the overall trend itself. Net jobs is simply using the Quarterly Census of Employment and Wages (QCEW) where the higher earning net jobs indicator uses both QCEW to find the overall average annual wage and the Occupational Employment Statistics (OES) to get the individual occupational data that determines individual wages within the sectors.
Unfortunately, overall net jobs in Walla Walla has been under performing the state and many other Eastern Washington metro areas. Overall jobs in the state have grown by a compound annual growth rate of 2% over the last ten years. Interestingly enough, Benton and Franklin Counties, Chelan and Douglas Counties, Yakima County, and Grant County all have grown by 1.5% over the last ten years, outperforming Walla Walla County by a full percentage point.
So, the data underscore that Walla Walla’s job growth has been variable (and low), especially in the higher wage occupations. Its path seems to run counter to the state in all three years of the trend. In addition to this, overall net jobs have been teeter-tottering from positive to negative growth pretty consistently for the last decade. A glimmer of hope, at least, is that the higher wage occupations added in 2019 come from a broad swath in the labor force, which in turn reduced the risk of a high concentration of jobs in a particular sector.
Overall Average Annual Wage – Growth in Walla Walla County outpaces state
by Scott Richter and Dr. Patrick Jones
Much of the average day in the average American’s life is consumed by the earning of wages. It is not uncommon for people working a regular 40-hour week to be around their co-workers more than their own families.
People also dedicate years of their lives and even go deep into debt to somehow ensure their ability to earn a good wage by going to college. But types of jobs and the wages they pay are not equally distributed across the U.S. The same is true for both the cost of living and the quality of life.
According to PayScale, salaried workers in New York City average $77,000 annually and workers paid-by-the-hour average $20.90. Yet, cost of living is almost 130% more than the U.S. average and wage growth lags far behind the increasing costs for housing, utilities, and groceries. New York City is also where the median home price is $1.63 million and median monthly rent is just north of $5,000.
In our state, salaried workers in Seattle average $80,000 annually and workers paid-by-the-hour average $22.89. The cost of living is almost 50% more than the U.S. average, while wage growth lags increasing costs for housing, utilities, and groceries. Median home price is $673,874 and median monthly rent is $2,111.
Compared to big cities, the Walla Walla Metro Statistical Area (MSA), encompassing Walla Walla & Columbia Counties is literally a completely different world for people who call the area home. Financially, for just Walla Walla County was $296,600 during the second quarter of 2020, and fair market rent for 1-bedrooms was $735, and $972 for 2-bedrooms. The overall cost of living in Walla Walla County is below the national average, as well as below other MSA’s in Washington State.
Looking at Indicator 1.1.4 Overall Average Annual Wage on Walla Walla Trends, we certainly see a difference in the county and state overall average annual wage. This is first due to demand for different workers areas across the state and in Walla Walla. Quite simply, demand for workers in the highest paying fields are not evenly distributed across the nation or state.
Getting into a more detailed explanation of what these data measure, it does not include salaries claimed by:
- self-employed.
- members of the military.
- students who both live and work on-campus.
- Native Americans working on reservations.
Nominal dollar values represent the dollar value at a particular time. For example, the nominal average annual wage during 2000 in the county was $25,996 and $37,101 in the state.
What does this mean? Looking at 2019, the most recent data available, we see both nominal and 2019-dollar values are identical, at $46,219 in Walla Walla County and $69,615 in the state. Moving backward in time, the nominal average wage shows the actual earnings of an area during a given year. This dollar amount can be looked upon as the average income submitted to the Internal Revenue Service by workers in a given area at an average paying job.
The result is two different trend lines for the same measure with one influenced by inflation (nominal values) and not the other (constant 2019-dollar value). For Walla Walla, one (the nominal rate) shows an upward trend over time; the other (inflation-adjusted) shows a much flatter line. In fact, in inflation-adjusted terms, the average annual wage has grown very little over the past two decades: from approximately $40,000 to approximately $46,000. By way of contrast, Washington’s average annual wage, inflation-adjusted, moved from about $57,000 to nearly $70,000. Since 2010 Washington average wages have grown by 43% cumulatively while those in Walla Walla have climbed less, by 29%.
Compared to other places in the state, such as the huge manufacturing and technology sectors along the I-5 corridor, Walla Walla County is obviously different. It is more than the absence of aerospace manufacturing and technology here. Instead, Walla Walla County’s mix of jobs, as the accompanying article in the newsletter explores, is heavily weighted to government, healthcare, and agriculture.
So, while growth of the overall average annual wage might not be occurring locally at the same pace as in the state, the cost of living in the Walla Walla metro area (Walla Walla & Columbia Counties combined) than some neighboring metro areas. Ultimately, it might come down to the perfect balance of perhaps earning a little less, but offering a desired lifestyle.