
Medicare Reimbursements
Tracking Health Care Spending
By: Trends Staff
It is commonly known that health care spending is on rise, but does that necessarily translate to better patient outcomes? The Dartmouth Atlas Project helps provide insight into whether health care spending is utilized wisely by using data provided by The Centers for Medicare and Medicaid Services (CMS). Medicare is the federally provided health insurance program offered to special population groups that include people 65 years of age or older, younger individuals with disabilities, and those with end-stage renal disease. Beneficiaries receive care from doctors, health care providers, hospitals, or facilities enrolled in the Medicare program.
This information is of particular interest since there is no counterpart available for the commercially insured population. It should be noted that patients enrolled in HMOs have been excluded from this data. Health Maintenance Organizations receive a fixed amount per enrollee regardless of total care provided to the patient. Differences in reimbursement rates generated by medical and surgery residency training programs and hospitals that serve a high percentage of low-income patients, have also been removed from this data set.
Th Dartmouth Atlas adjusts rates by age, sex, and race. This adjustment corrects demographic differences between populations by using estimates that assume an identical composition. A higher population of older individuals in a certain area for example, might skew Medicare spending as people tend to require more medical care as they age. Regional price differences are also taken into consideration. Although these factors did account for some of the variation in Medicare spending across the region, utilization proved to be more determining factor in regional payment variation.
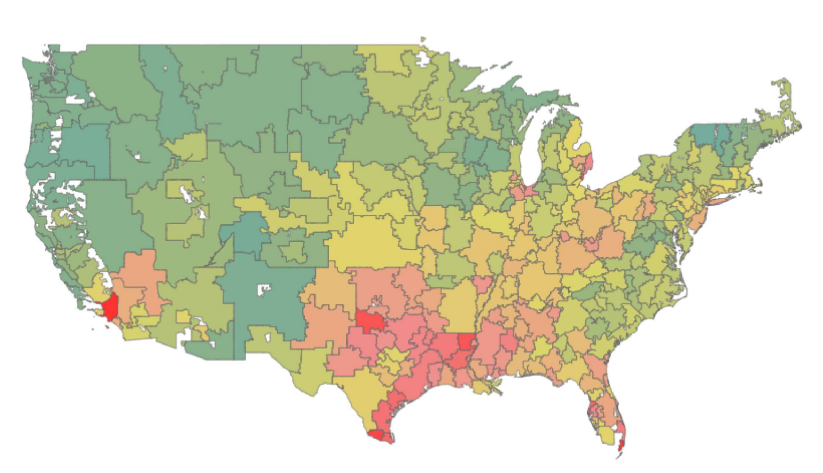
Interactive maps show Healthcare Reimbursements per Enrollee, either by HRR (Hospital Referral Regions), HSA (Hospital Service Areas), or by State. A consistent trend can be observed on the HRR and State maps, showing higher rates in the Southeast corner of the country. More details are available by hovering a particular area. Washington State for example, had a Medicare population of 643,939 persons in 2019, and an adjusted rate of $9,188.14 per enrollee.
Using the filtering option and selecting only Washington state HSAs provides a more detailed view of spending across the state. The Colfax, Forks, and Kennewick service areas are the highest in the state, ranging between 15.7 and 22.0% above the state average. Walla Walla's rates were lower than the state average, coming in at $8,772.95 and a Medicare population of 10,653 people in 2019.
2019 is the latest year available through the study although visitors can view data as far back as 2011. Bar graphs and distribution charts are available by clicking on the left-hand corner of each map. The Dartmouth Atlas of Health Care site has additional interactive applications to explore such as End or Life Care, Surgical Discharges, and Data by Hospital to name a few.