By Dr. Patrick Jones
Did you feel like there was more coin in your pocket in 2020? More dollars loaded on your debit card? According to U.S. Department of Commerce data, you should have.
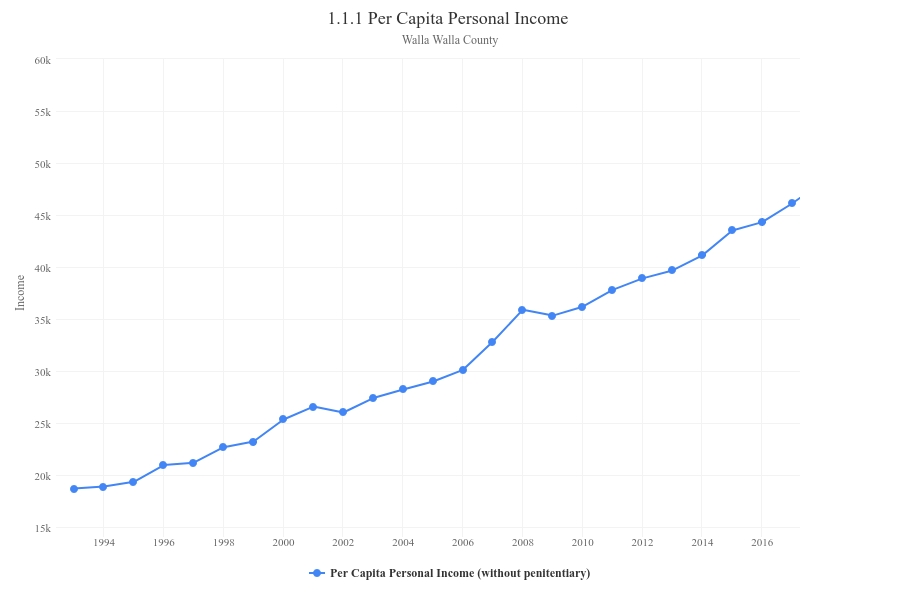
As Walla Walla Trends indicator 1.1.1, Per Capita Personal Income (PCPI), lays out, 2020 ushered in a quickening to Walla Walla’s economy. Tracing the upper red line, one quickly sees that the pitch of this measure of income steepened in 2020. The value, nearly $54,000, represents a 9.3% increase over 2019, the fastest advance since 2008.
That jump bested the increase in the U.S., at 5%, and in the state, at 4%. The indicator displays two versions of per capita personal income for the county. The first strips out the average annual census of the Washington State Penitentiary from the denominator, since those inmates compose a disproportionately high percentage of the population compared to other counties. The lower line reproduces the data as released by the U.S. Department of Commerce.
Why such a large spike in the growth rate in 2020? To answer that, let’s refresh our knowledge of income. Personal income rests on three legs. The first and largest consists of earnings from work. Over the past decade, earnings from work has ranged from 56% to 60% of all personal income in Walla Walla.
In 2020, total earnings from work climbed by $176 million, or nearly 11%. That increase is far from the typical year-over-year percentage increment of 3-4%. The Trends offers a good proxy of changes in this area by considering the average annual wage. Indicator 1.1.4 shows a jump between 2020 and 2019 of about 5%.
Note that this latter measure, by definition, is not a total. Further, it doesn’t account for residents who may live here but work elsewhere. Nor does the wage indicator capture earnings from work of sole proprietors. So one shouldn’t read too much into the differential growth rates.
The second leg consists of investment income, whether from tangible or intangible property. Or, the total of dividends, interest and rent. In Walla Walla, investments usually amount to 17-22% of total income. But their share actually declined in 2020 over 2019. (The amount increased, however.)
The third leg is usually the second-largest in Walla Walla: federal transfer payments. These are defined as payments for which no good or service was exchanged. Reflecting the complexity of our mixed economy, these payments flow from a myriad of federal programs. For Walla Walla, the five largest sources have been, in order: social security, Medicare, Medicaid, Supplemental Nutrition Program (SNAP) and various Veterans’ programs.
Dollars from these and other programs in pandemic year 2020 pumped almost $820 million into the county. That’s up from an average of $625 million the prior three years. In an economy the size of Walla Walla’s, that’s real money. Altogether, federal transfer payments represented 26% of the entire economy in 2020.
Contributing most to the transfer payments increase was a significant bump in unemployment insurance from a prior three-year average of $5.9 million to over $58 million(!). In addition, all five major programs increased their payments to the County by $5-10 million each.
We will not know 2021 income levels until next November. The evidence available, however, is of an economy continuing its momentum. Employment in every month of the year was higher than in 2019. With the exception of January, the unemployment rate in every month was lower than 2019. Significantly, monthly labor force numbers, the number of employed plus unemployed, were higher every month than in 2019.
A good portion of the extraordinary unemployment benefits paid out in 2020 were then replaced by wages in 2021. This undoubtedly led to SNAP payments receding somewhat, but other income maintenance programs likely held steady. And population in the county, the denominator in PCPI, actually declined in 2021, as Trends indicator 0.1.1 reveals. This unusual decline was likely due to the absence of students at the two 4-year institutions who live off-campus. As a consequence, expect per capita personal income in 2021 to yield another sharp rise.
Further evidence of income gains in 2021 comes from a large part of the economy closely tied to income: consumer spending. We can estimate this spending via retail taxable sales data. In the first quarter, these sales came in 24% greater than the same quarter in 2020 and far above those of 2019. Second quarter taxable retail sales kept the same pattern: 36% larger than the same quarter in 2020 and much higher than 2019. Third quarter sales, the latest available, were 17% higher than in 2020.
All in all, Walla Wallans should have felt even more money the pockets and purses in 2021 than in pandemic year 2020. This year will likely be a different story, however. Gains are likely but at a more much slower pace, if for no other reason that the county has enjoyed two years of unprecedented.
This is an updated and revised version of a prior column that ran in the Walla Walla Union Bulletin.