By Dr. Patrick Jones
Have you recently wondered why Walla Walla’s home prices keep leaping upward? By the end of last year, the median resale value for a home nudged up against the $400,000 mark. That represents a jump of nearly $140,000 over the past two years. What is going on?
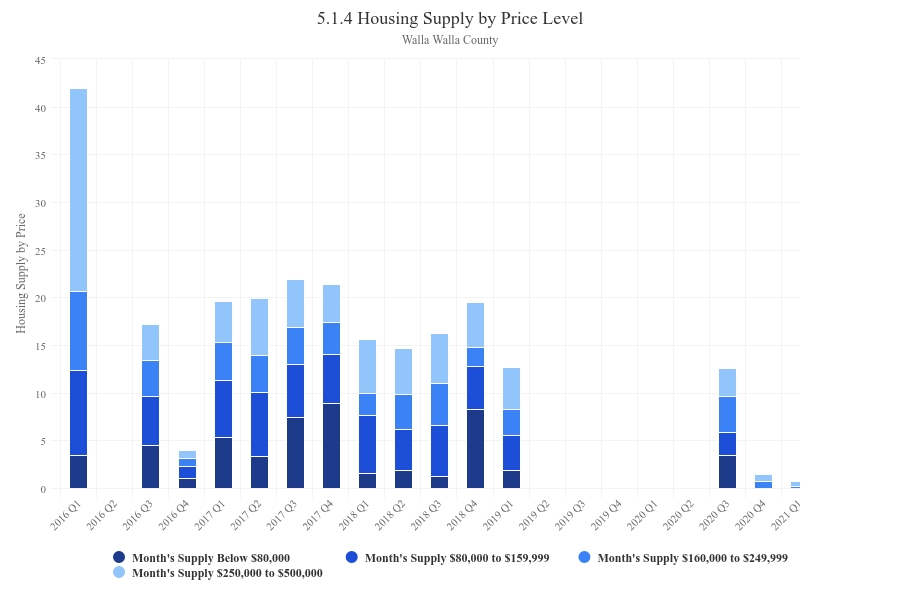
Look no further than the supply of listed homes for sale in the County, found on Trends indicator 5.1.4. This measure, from the Washington Center for Real Estate Research at the University of Washington, portrays supply as a monthly equivalent assuming current sales rates were to follow those of the immediate past.
The indicator disaggregates the monthly equivalent by different price brackets. Traditionally, the Center has used five segments of monthly equivalent of supply in the housing market: listings less than $79,999, listings between $80,00 and $159,999, listings between $160.000 and $249,999 and listings between $250,000 and $499,999. Listings and the resulting monthly supply equivalent of homes over $500,000 are not tracked by this indicator but are available from the Center.
A cursory look at the accompanying graph shows stacked red bars (Walla Walla County) for the past year with only two categories represented: the top two. Inventory in the range of $80,000 to $159,999 was unavailable, in other words, not present. Of the two categories observed in the most recent quarter, Q4 2021, the implied monthly supply of homes was less than one month each: 0.4 months! Or altogether, 0.8 months.
From a seller’s perspective, this is wonderful position to be in. That is, unless sellers are interested in staying in the local market and purchasing a home at least as expensive as the one they are selling. And housing markets have traditionally been replete with residents acting as both buyers and sellers. Think of the trading up habit that many Americans have long practiced. Climbing the housing ladder is not as easy now, at least for the average household.
Of course, Walla Walla’s red-hot housing market is not unique. The paired green stacked bars offer a similar breakdown of supply in monthly equivalent for the entire state. It is easy to see that throughout Washington, supply is a bit more robust. But not by much. All four segments sum to a total supply of 3.9 months’ equivalent for the most recent quarter, Q4 2021.
Over the six years tracked by this Trends indicator, the monthly equivalent of supply throughout the state has declined. But gradually. In contract, the decline here has been abrupt. Unfortunately, Center did not report data for several quarters in 2019 and 2020. When the collection resumed, however, a noticeable shift took place. Or perhaps better put, an earthquake.
The County supply of listings moved from an average of 15-20 months’ equivalent over all price ranges to the levels now facing the Walla Walla market. Will this incredibly thin supply be the new normal?
Unless local builders crank up construction activity in the near term, probably yes. Or, unless residents suddenly start leaving Walla Walla en masse, then yes. Both scenarios look highly unlikely.
Economists like to think that high prices solve high prices. But those solutions take time. And it appears the new home supply will remain in the short- to medium-term a trickle. The relative scarcity of the triad of land, lumber and labor will constrain new construction, and rising costs that follow will push new construction to higher prices, likely much higher than three years ago.
On the other hand, rising mortgage rates may start to tamp down demand. With the conventional 30-year rate now north of 5%, some potential buyers will hit the pause button. But maybe not that many. After all, those of a certain age remember mortgage rates in the double-digits and the housing market didn’t collapse.