By Dr. Patrick Jones
As is now known, pandemic year 2020 did not bring the local economy to a halt. Yes, employment, especially in the a few sectors, took a huge hit. But due to unprecedented fiscal and monetary stimulus, a key summary measure – total, real (inflation-adjusted) personal income -- chalked up a 5.3% gain in the U.S. Washington State registered a slightly higher increase of the same measure – 6.3%. And as can be found in the data to Walla Walla Trends indicator 1.1.1, total income in Walla Walla County climbed by about the same amount in 2020 as in the state.
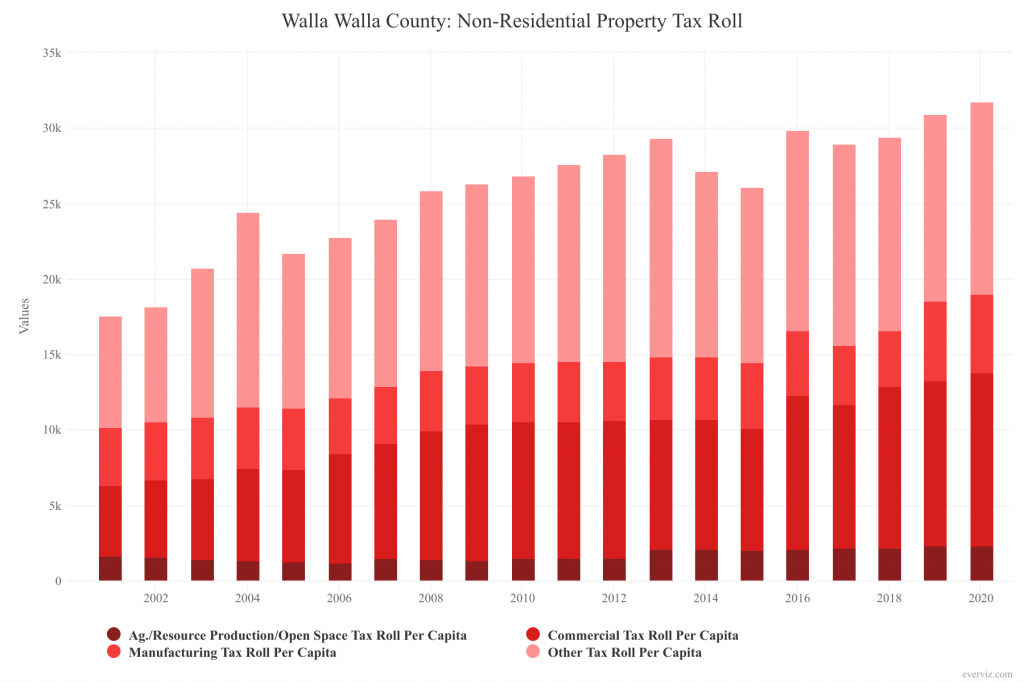
What about assets? In our accounting of economy activity, we tend to forget them. Trends indicator 1.5.4, Non-Residential Property Tax Roll – Assessed Value per Capita, reveals that for at least part of the County economy’s aggregate balance sheet, value increased as well in 2020. Total value of asset types covered by the indicator moved up 3.3% over 2019. Since there was some population growth in between 2019 and 2020, the per capita measured nudged up slightly less, at 2.7%.
Why should we care about this particular indicator? In general, it captures a good portion of the real property in a community. Real property consists largely of those assets of value that cannot be moved, largely land and buildings. In a word, this indicator looks at a significant part of the wealth of Walla Walla.
For sure, other sources of wealth exist. A key omission from a total measure of wealth in this indicator is residential real estate. According to the source, Washington Property Tax Statistics 2021 from the Department of Revenue (DOR), the assessed value of residential real estate summed to $4.15 billion in 2020. That made up about two thirds of the total assessed value of real property in the county in 2020, approximately $6.2 billion.
Also absent is the value of farmland. Valuation of that asset comes two ways in Washington state – “true and fair value” and “current use.” The latter, the taxable base, is much lower. In 2020, current use of agricultural and open space lands in the county was approximately $510 million. Contrast that to the “true and fair value” assessment of $1.5 billion.
If we regard Trends indicator 1.5.4 as a measure of wealth, the final missing piece of tangible property comes from personal property. This category is made up smaller-sized assets that can be moved. The taxable base for this asset class in 2020 was about $330 million. That total, however, is much lower than all personal property in the county. Farm machinery is excluded from the 2020 numbers. And Washington state doesn’t tax, so it doesn’t track, significant personal property classes, such as transportation vehicles and household appliances and equipment.
The indicator Non-Residential Property Tax Roll consequently consist of four types of real property - “open space” land, commercial land and buildings, manufacturing land and buildings and “all other” real property not a part of the first three types nor residential. As one can quickly see in the graph, “all other” and commercial categories are close in size while manufacturing real property ends up 3rd largest. The value of “open space” land is a fraction of the other three categories.
Since 2017, every year has brought an increase in total and per capita valuation of these segments of real property in Walla Walla County. Generally, the sources, of increases stem from revaluations or creation of new assets. DOR reports do not break out the increases in real property by class by either source. But we do know that between 2019 and 2020, about half of the gain in total real property valuation (1.8%) was due to new assets coming online.
In the end, this indicator matters because it reflects the efforts of most economic development activities – the growth of the industrial and commercial sectors. While jobs and their accompanying salaries make up the typical metrics in a local economy’s economic scorecard, additions to real property almost always follow. As with all businesses, the balance sheet matters just as much as income statements.
To completely assess Walla Walla’s balance sheet beyond the categories tracked by this indicator, as well as those missing categories we have noted, we must consider one more class: Intangibles. Increasingly in the U.S. economy, the value of intangible property, such as patents, copyrights, trademarks, even company culture, is as important as tangible property. Estimates, for example, put the share of intangible property in the valuation of the companies in the S&P 500 at 80%!
Our ability to track this kind of asset in Walla Walla County is essentially nil, since analyses of this type are based on publicly-held companies. It is this writer’s strong hunch that intangibles likely don’t make up the majority of total asset value in the Walla Walla economy. Much of the non-residential real property here is tied up in agricultural, real commercial and real industrial assets. Over time, however, the intangible component will likely grow. Consider, for example, the value of the cachet of Walla Walla behind wineries and vineyards. As other mid-sized headquartered companies in Walla Walla grow, they will contribute to the total intangible asset base.
For now, however, the Trends’ ability to track aggregate economic assets will stay decidedly 20th century.