
The Walla Walla Trends project seeks to improve local, public decision making by providing relevant data in an easily navigable website. The data provided on this website is offered as neutral information.
This page will be updated and email alerts sent on a quarterly basis. Don't miss an update - subscribe today!
Recent Updates
In ECONOMIC VITALITY: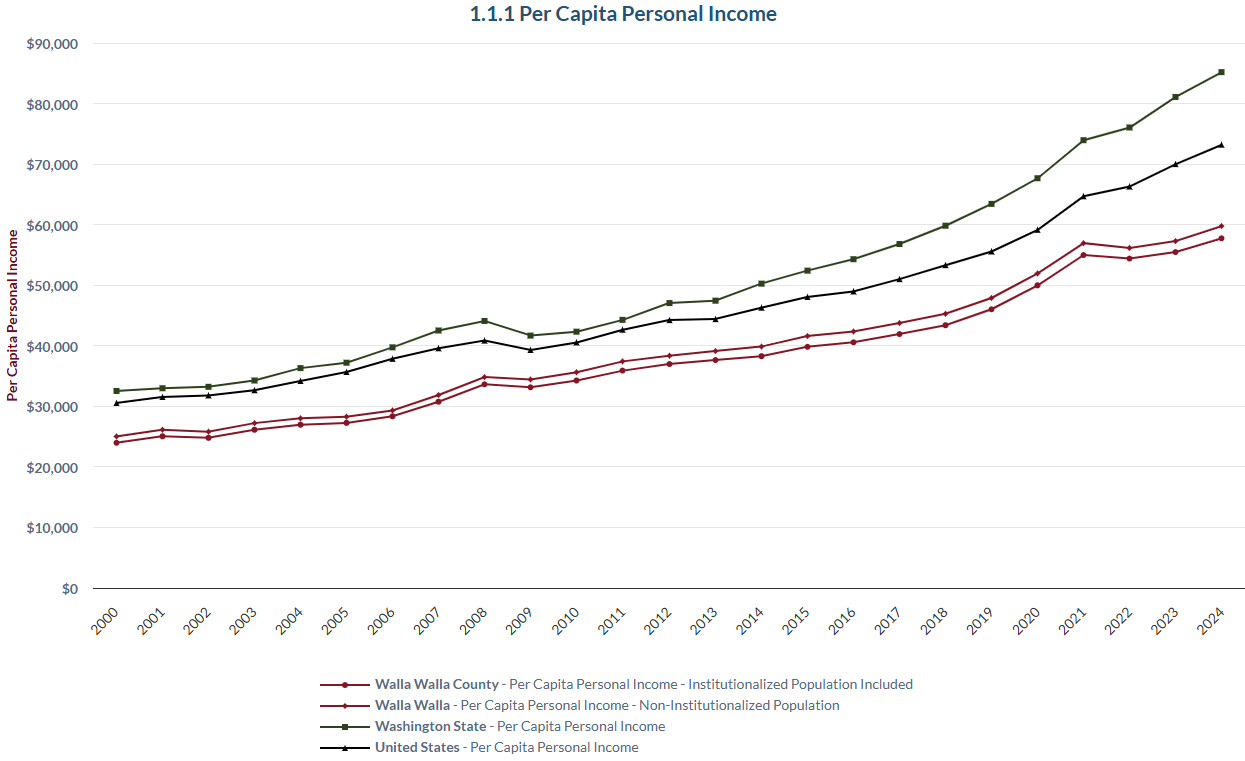
Per capita personal income rises absolutely but falls relatively in the County.
Per capita personal income (PCPI) is one of two broad measures of personal income; the other is median household income. Both are used to track economic progress. Per capita is an average and based on administrative records. For Walla Walla Trends, the measure is presented both as found in government data and as adjusted for the state penitentiary population.
In 2024, adjusted PCPI in the county nearly reached $60,000. Compared to the U.S., this represented 81%. Since 2019, the county’s relative standing in this measure has slipped from 86% of the U.S. level. A similar decline in relative standing can also be found in the median household measure, found in indicator 1.1.2. Why might this have occurred? A quick look at PCPI’s three components shows that the largest is also the slowest-growing: earnings from work. (The two others are investments & federal transfer payments.)
To boost incomes here, look to boost earnings from work.
To simplify the graph, click in the legend on those items you would like to hide.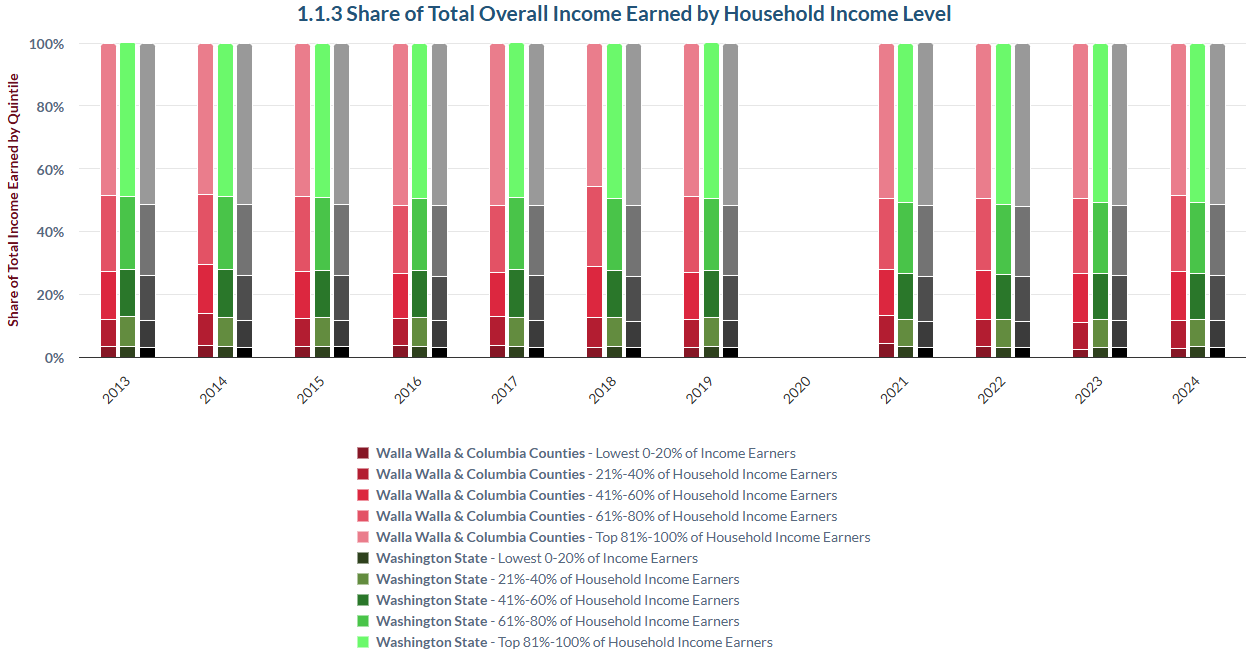
Income distribution shows Walla Walla to be slightly more equal than its benchmarks.
This indicator displays the distribution of income by segmenting’s the results of the annual (Census) survey into quintiles. Each quintile represents the share of total estimated income in the county taken by one fifth of households – from the lowest 20% to the highest 20%. While a more complete assessment of income distribution involves calculating a Gini coefficient, data does not permit this at the local level. But one can look at the relative sizes of the quintile shares.
Via the approach, one can see the highest quintile of the Walla Walla metro (Walla Walla and Columbia Counties) households in 2024 claimed about 49% of total income. Contrast this to its counterpart in the state, at 51%, and in the U.S., at 52%. Or, consider the middle quintile: those households here claimed 16% of total income in 2024 vs. 15% and 14%, respectively, in the state and U.S.
Quintile shares have changed little over the past decade.
To simplify the graph, click in the legend on those items you would like to hide.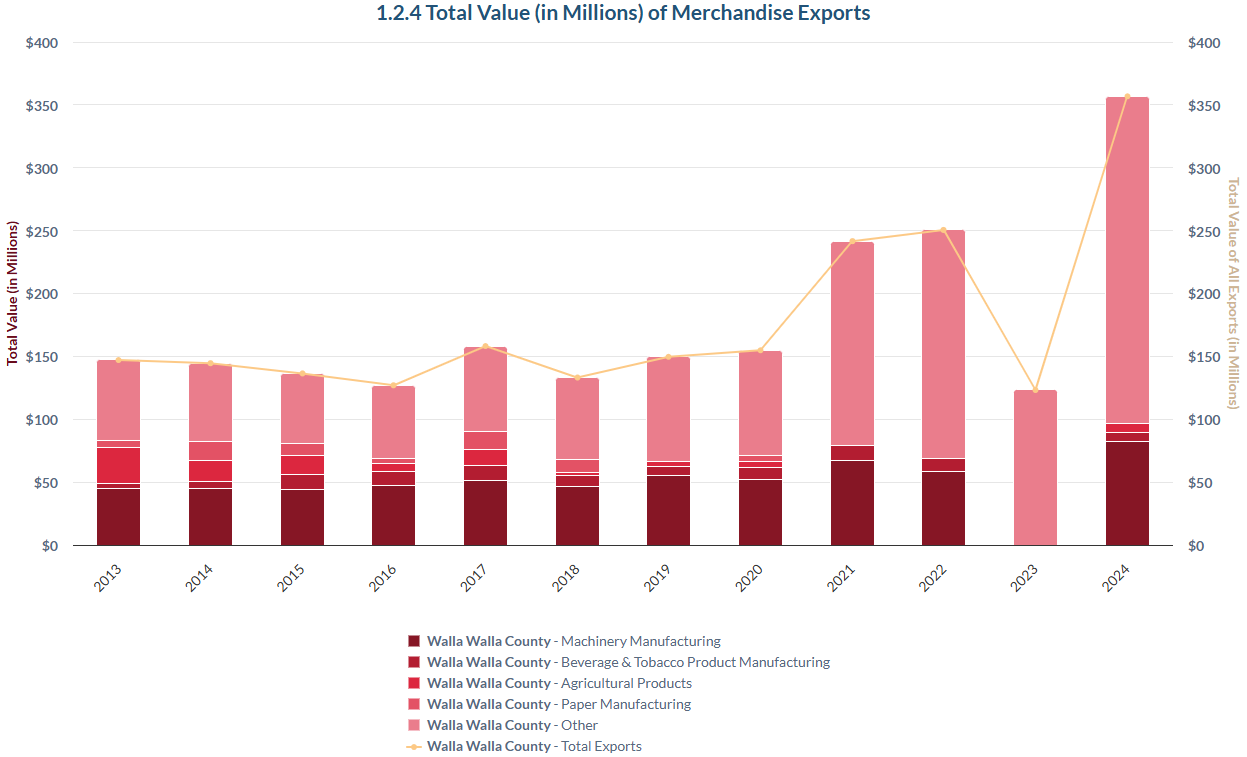
Merchandise exports have risen sharply since the outbreak of the pandemic.
This measure tracks exports of goods from the Walla Walla metro area (Walla Walla and Columbia Counties) to other countries. Export of services are not part of the total. Selling goods to other countries, or for that matter, simply beyond county boundaries, is a sure-fire way of expanding the local economy. This indicator tracks the top 4 categories of goods, plus an “all other” group.
In 2024, county exports of goods reached $357 million, by far the highest on record. One can observe the start of a growth trend in 2021. (Ignore the 2023 results, as the data provider, U.S. Department of Commerce, suppressed several categories.) Among the top five categories, machinery was by far the most important. In distant 2nd and 3rd places were beverages and agricultural products, respectively. Rounding out the top 5 industries were exports of processed foods and paper.
Will the metro area continue to punch above its weight in international trade?
To simplify the graph, click in the legend on those items you would like to hide.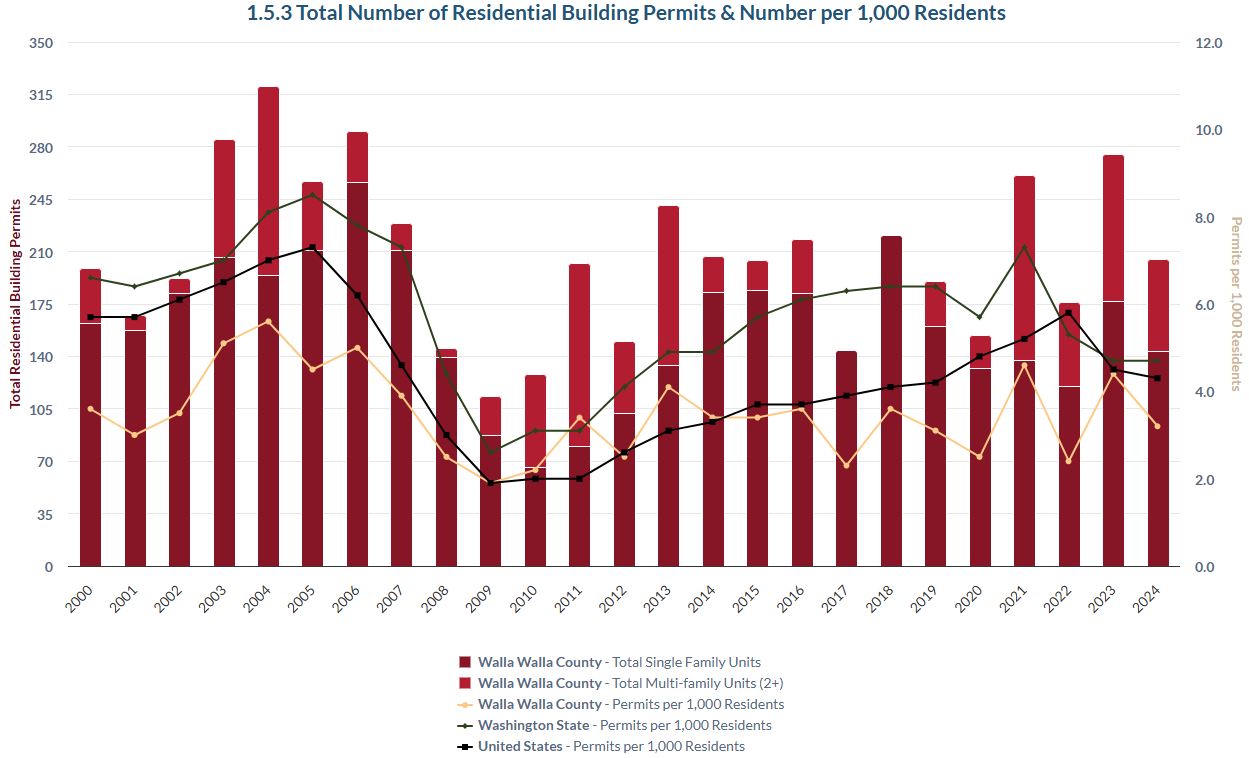
Quarterly residential building permitted units slumped in 2025.
Construction is typically one of the pillars of a local economy, and residential construction is one of four large areas of construction. (The others are commercial, industrial, and public works.) Most of the U.S., additionally, suffers from inadequate supply of housing units, be they single- or multi-family, so supply measures have attracted lots of attention recently. Finally, construction activities pay sales taxes, which in turn are a key leg of local government revenues.
2025 was not a robust year for residential building permits, and hence, construction, in Walla Walla County. A total of 162 units were permitted. Contrast this to the count a year prior: 262. The number of permits per 1,000 residents, as can easily be seen in the graph, was considerably below the state rate last year. But relatively weak numbers of permitted units haven't characterized the County for at least a decade.
In EDUCATION: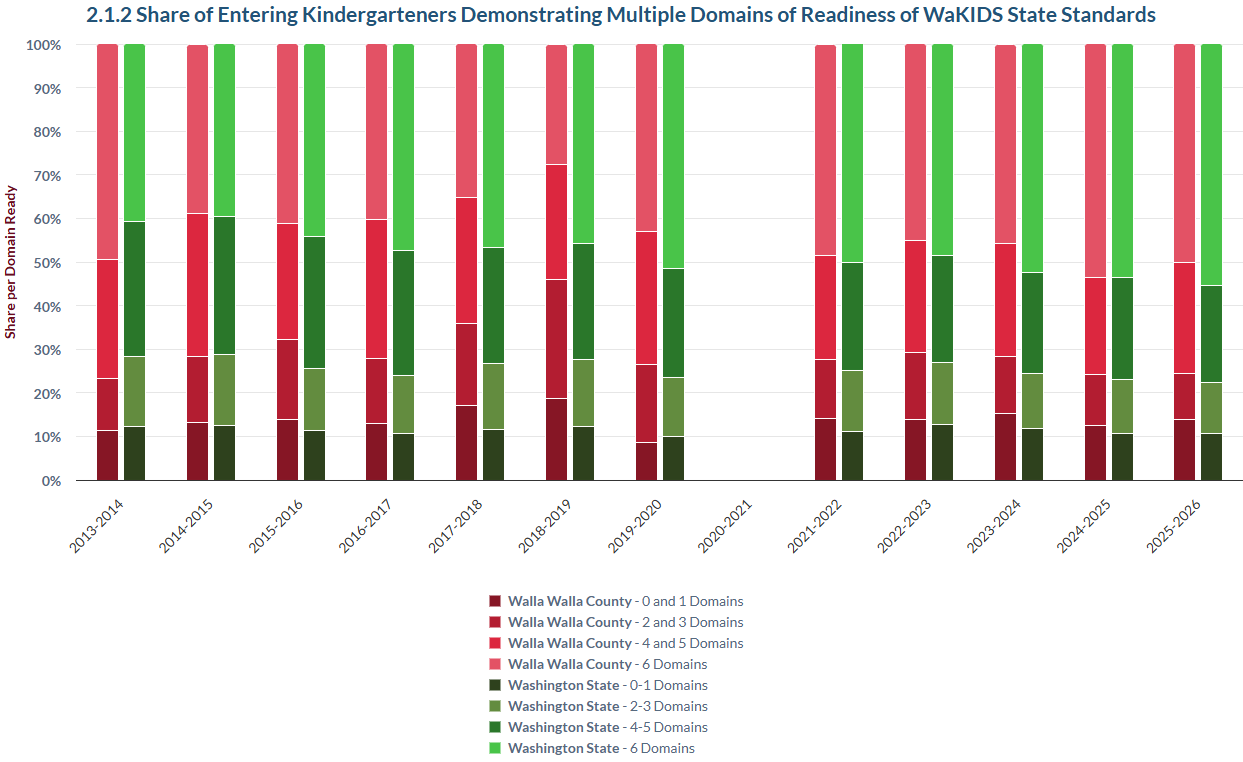
Kindergarten readiness nudges up in county public schools.
Since 2014, Washington state public schools have administered a fall assessment to incoming kindergarteners. The assessment scores whether a young student is at the appropriate level to start kindergarten in six domains: cognitive, verbal, literacy, math, physical and social/emotional. Ideally, a child is deemed as “ready” in all six domains.
For the incoming class of Walla Walla County public school kindergarteners in 2025, half of the students were deemed ready in all domains. This is the second-best showing in the history of the assessment; only the prior year was higher. While better than ever before, the local results still lag those of the state. In 2025, the share of all Washington entering kindergarteners showing readiness in all six domains was 55%.
To simplify the graph, click in the legend on those items you would like to hide.
In EDUCATION cont: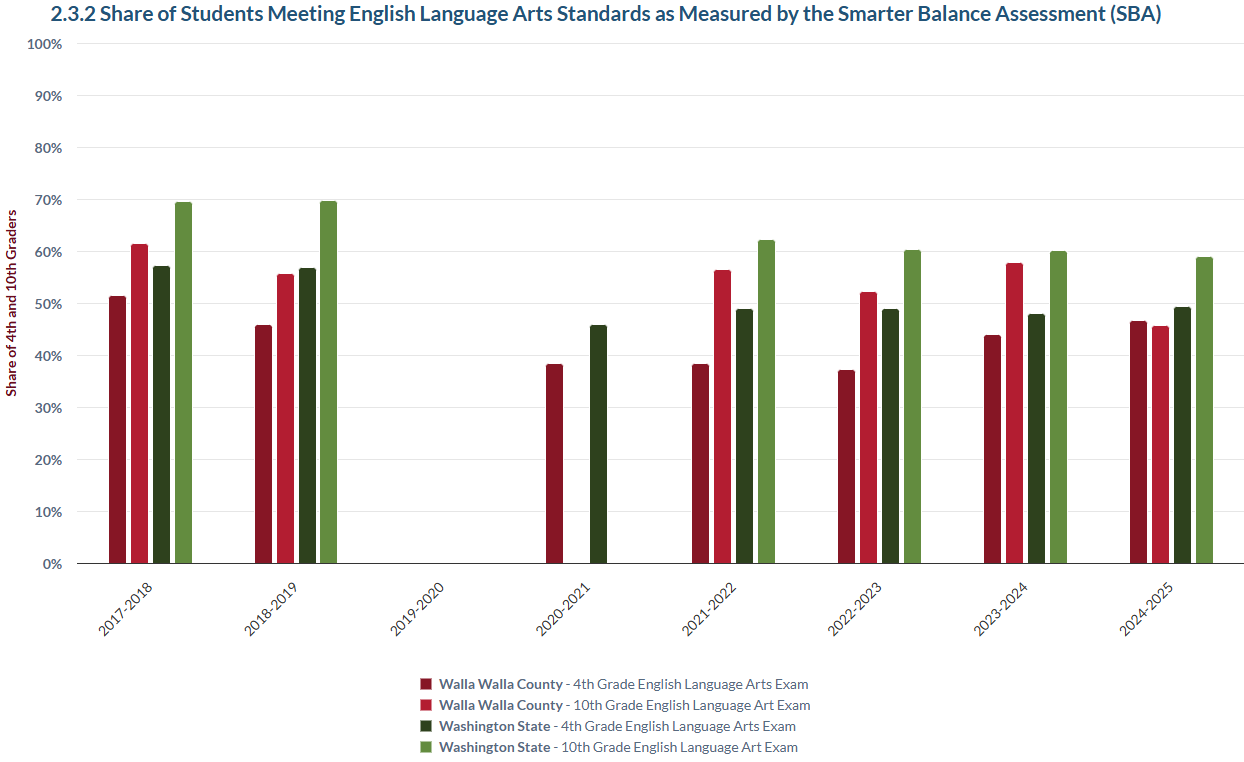
Every spring, Washington public school students are subject to a learning assessment. The assessment is known as the Smarter Balanced (SBA) and is based on a national standard, the Common Core. The SBA covers math and as expressed in this measure, English Language Arts (ELA). Students are scored at four levels, with the upper two considered “meeting standards.” This indicator tracks the shares of students meeting standard in 4th & 10th grade in the ELA.
For the 2024-2025 school year, about 47% of Walla Walla County public school 4th graders meet ELA standards. This is the best result since school year 2017-2018. It is still a bit below the state average, however. About 46% of County 10th graders met standard. This the lowest average on record, coming in far below the peak of 62% observed in 2017-2018. Further, this showing is far below the state average, a continuation of a pattern seen since the start of the assessment.
To simplify the graph, click in the legend on those items you would like to hide.
In HEALTH: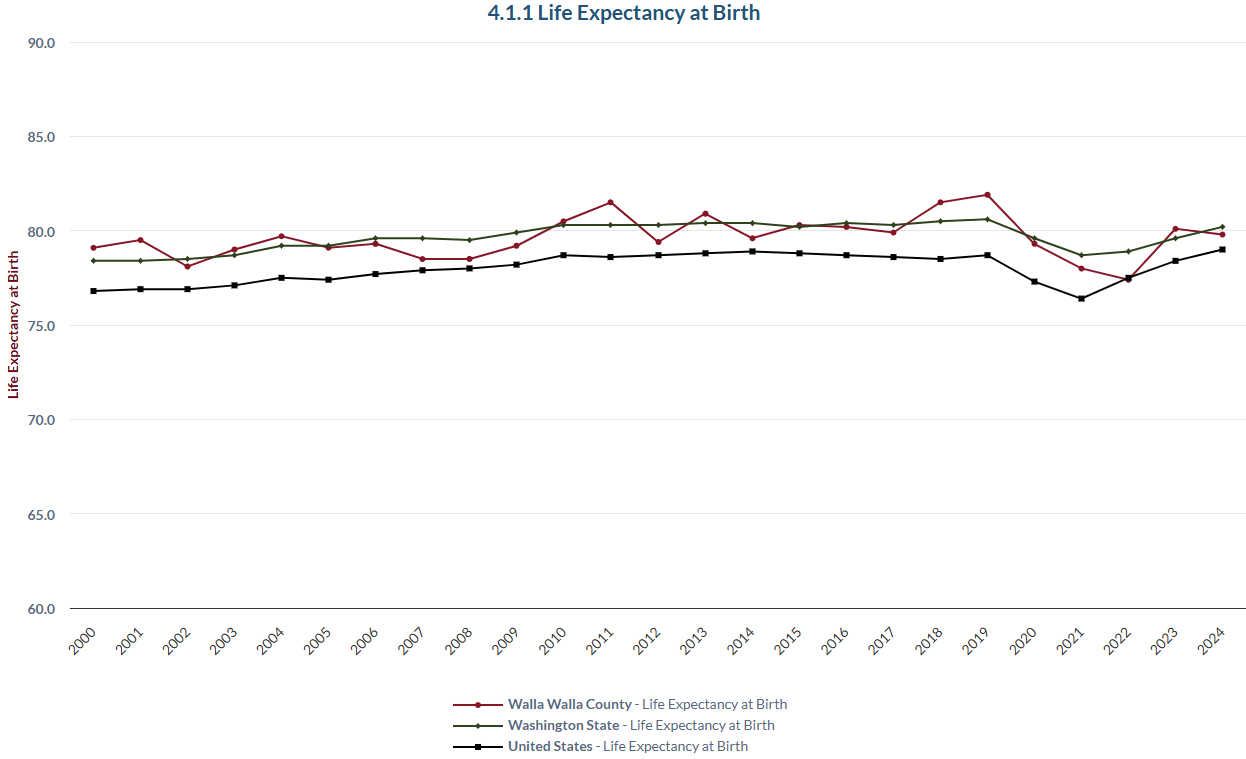
Life expectancy at birth is rebounding but still lags pre-pandemic levels.
Life expectancy is an “apex” public health indicator, as it reflects so many conditions facing a community or nation. Specifically, it is based on the assumption that current age-related mortality rates hold true to for newborns in a given year.
After slipping to 77.5 years in 2022, Walla Walla County life expectancy rebounded to 79.8 years in 2024. This put the County slightly below the state rate (80.2) but a bit higher than the U.S. average (79.0). Local life expectancy, however, has yet to re-gain the level it achieved in 2019 of 81.9 years, when it was higher than both the U.S. and state average.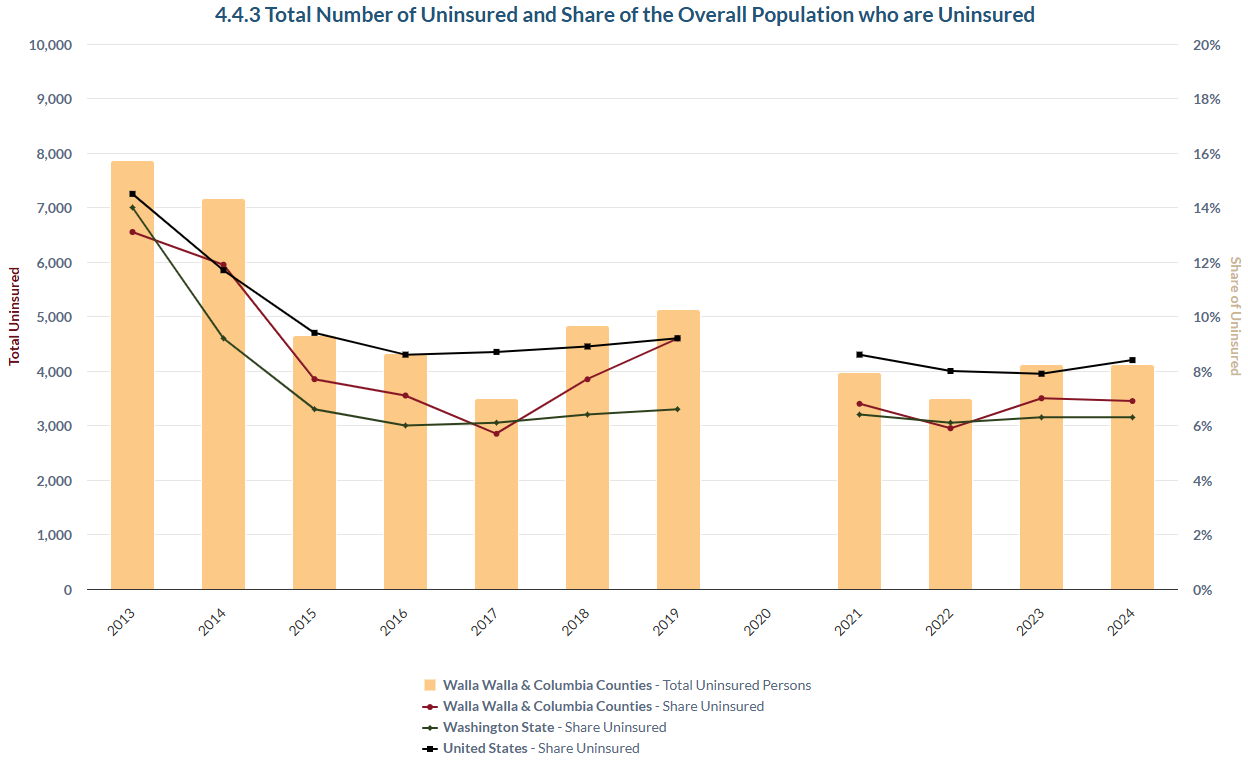
The number and share of metro area residents without health insurance remains stable.
Good health depends on many factors deemed non-medical, such as adequate housing and income. But medical factors play a role, too. For example, without health insurance, it is difficult to receive care, and certainly appropriate care, such as access to preventive care.
Since the advent of the Affordable Care Act in 2014, the number and share of metro area (Walla Walla and Columbia Counties) residents without health insurance has declined rapidly. From 2021 on, the numbers have been quite stable. For 2024, Census estimated that about 4,130 residents were without insurance, or nearly 7% of the metro area population. This has largely been the case since 2021.
Currently, the share here without insurance is slightly larger than the state share, but considerably less than the U.S. share.
In HOUSING: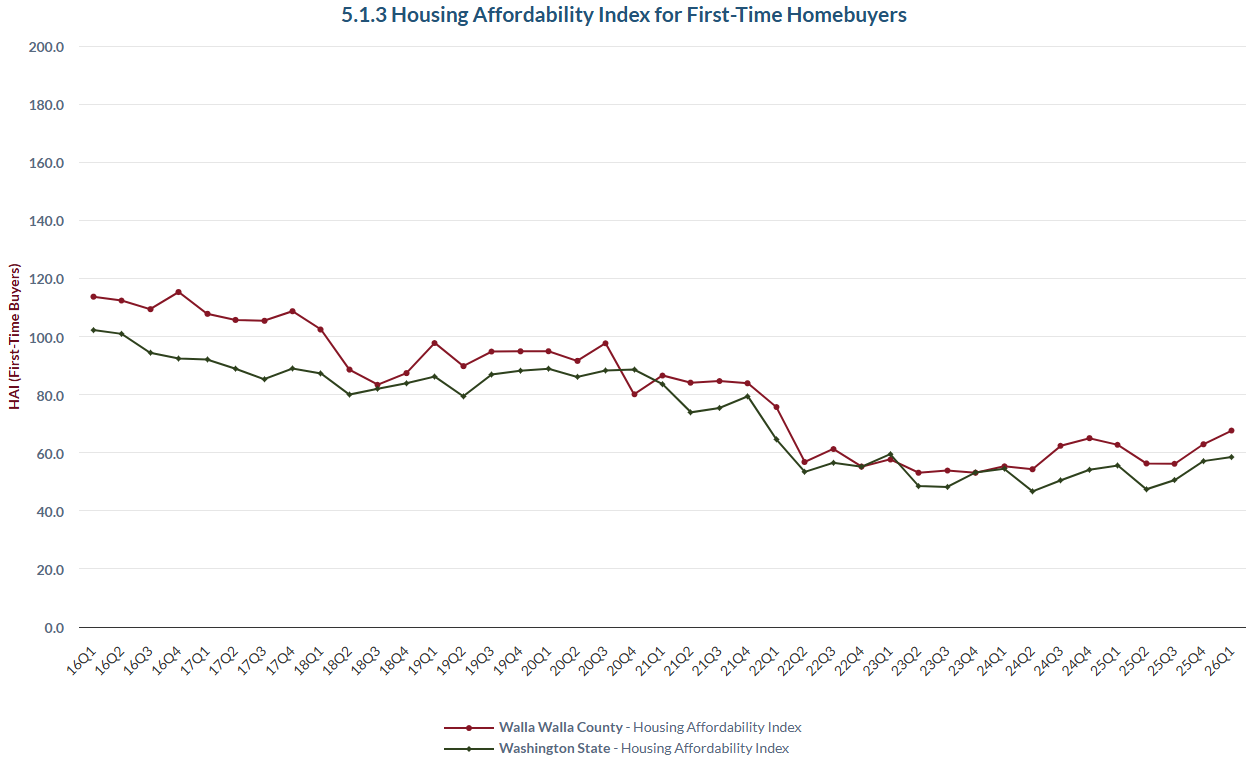
First-time buyers’ affordability index has crept up, but not by much.
Housing prices tell a story. But housing prices juxtaposed to income tell a more complete story. This indicator examines the affordability of a house for a household with less than (70%) the area median income to purchase a house at 85% of the current area median. It’s shorthand for first-time buyers.
As an index, it is scored so that households with this income (or lower) will receive a value of 100 if their home purchase takes 25% of household income. If the household spends less, then an index value greater than 100 follows; if more is spent, then the affordability index yields a value less than 100.
For Walla Walla County in the most recent value, the last quarter of 2025, the index value lies far below 100, at about 63. It has been in that range for a year and a half. In the immediate aftermath of the pandemic, it fell to the mid-50s, at the graph reveals. Yet, Walla Walla wasn’t always unaffordable to this type of buyer. In the years before 2018, the index values were consistently greater than 100.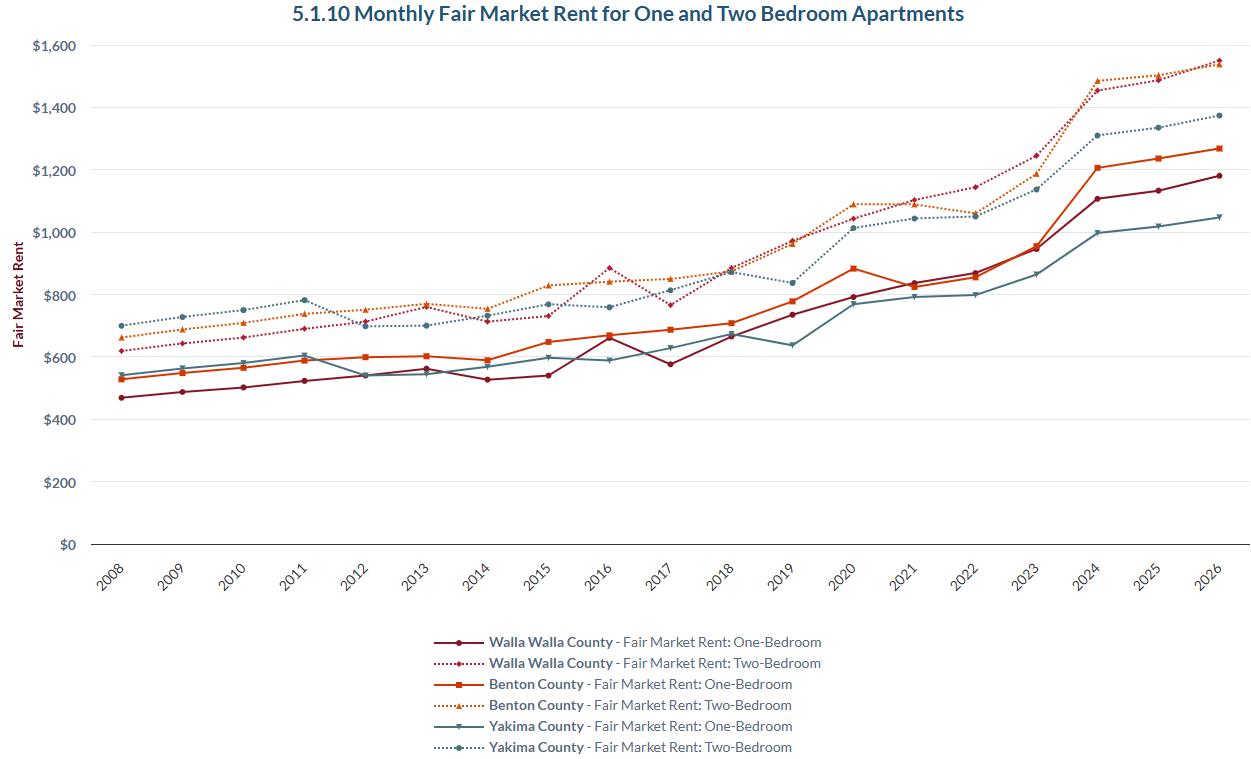
Fair market rent for a 2-bedroom apartment in Walla Walla County is now $1,550.
Every year, the federal agency charged with administering housing programs (vouchers) issues a monthly rental amount for counties that reflects market conditions. More specifically, the Department of Housing & Urban Development (HUD) provides this estimate of what a family can expect to pay for modest rental housing. It includes the rent plus the cost of all tenant-paid utilities, with the exception of telephones, television, and internet services. Fair Market Rents must be high enough to allow for a selection of both units and neighborhoods, and low enough to serve as many low-income families as possible.
For 2026, Fair Market Rents (FMR) in Walla Walla County were set at $1,550 and $1,181, for two- and one-bedroom apartments, respectively. A decade ago, they were $766 and $576, respectively. The intervening 10 years has brought about a doubling!
As the graph illustrates, Walla Walla’s 2-bedroom FMR is nearly equal to the value in the Tri Cities. It’s 1-bedroom rent, however, is a bit lower than in the two neighboring counties to the west.
To simplify the graph, click in the legend on those items you would like to hide.
list updated 5.14.26
New Intern Features

Janay Bowen
Hometown: San Jose, CA
Major: Professional Accounting
Expected Graduation Date: Spring 2027
Post-graduation plans: Work at a local accounting firm to become a CPA.
After a few months of working on the Trends project, my favorite thing so far: My favorite thing so far is when I get into the flow state of work, and I am understanding and creating spreadsheets that I know help the counties we work for.